 |
| Maruti Daily Long Term Chart |
Monday 11 July 2016


Sunday 3 July 2016
Support and resistances are marked on the chart.


Support and resistances are marked in the chart.
 |
| Maruti Daily Chart |
Support and resistance levels for Tata Motors are shown below in the chart. A diamond form of consolidation at the top which is generally bearish.
 |
| Tata Motors Daily Chart |
Banknifty support and resistances are marked in the below chart.
 |
| Banknifty Daily Chart |
Nifty support and resistances are shown in the chart.
 |
| Nifty Daily Chart |
Saturday 4 June 2016
Bullish Possibility:
Last week in Deb Trades we mentioned that,
Last week Banknifty opened at 17581 made a low at 17350, high at 17762 before finally closing at 17681. Hence a weekly gain of just 100 points and a range of 412 points. For ST positional traders this is a range move.As can be seen from the above chart till Banknifty is trading above the upper blue line bulls are safe. The first support zone is at 17442-17302, next 16997 and final support zone is at 16343-16197. Targets are as marked on the chart, 1) 18036 2) 19041 and 3) 20553
Now let's analyze Banknifty for this week.
 |
| Banknifty Daily Chart |
As can be seen from the above daily chart of Banknifty, it is clearly moving in an ascending channel (black lines) and the targets are as marked on the chart, 1) 18036 2) 19041 and 3) 20553 while supports lies at 17442-17302, next 16997 and final support zone is at 16343-16197.
Bearish Possibilities:
Same as last week:Bearish possibilities are currently muted now as long as we trade above the upper blue line of the falling broadening wedge pattern (blue lines). But in case if we then the immediate target would be 16343 and 16196.
Summary:
1) Banknifty is bullish still within the ascending channel.
2) The first support zone is at 17442-17302, next 16997 and final support zone is at 16343-16197.
3) Targets are as marked on the chart, 1) 18036 2) 19041 and 3) 20553
2) The first support zone is at 17442-17302, next 16997 and final support zone is at 16343-16197.
3) Targets are as marked on the chart, 1) 18036 2) 19041 and 3) 20553
Final Words:
If you like this post do share it and leave your comment. Any question related to the topic? Feel free to ask.
Trade safe and keep checking this space for any further updates on developing resistances in between. Also check out our other publications on Nifty, Bank-nifty and other stock specific at the left hand column.
Trade safe and keep checking this space for any further updates on developing resistances in between. Also check out our other publications on Nifty, Bank-nifty and other stock specific at the left hand column.
Labels:
ascending trend channel
,
Falling broadening wedge
,
Range
,
Resistance
,
Support
No comments
:

Bullish Possibility:
Not much update in Cairn as the trade is yet to trigger.
 |
| Cairn Daily Chart |
Last week in Deb Trades we discussed that,
As can be seen from the above chart that all 5 bearish waves looks like completed in Cairn and this stock is going to start a new bullish cycle now. Though I expect wave 1 of this bullish cycle already done at 158.4 and we are now in the wave 2 correction and almost about to break the down trendline. Hence it is a sure buy above 150. As can be seen from the above chart first target is the Fibonacci 38.6% i.e 213, 2nd target Fibonacci 50% i.e 246 and 3rd target is Fibonacci 61.8% i.e 279.
Bearish Possibility:
Same as last week,
Bearish below 150 hence if you enter a long at 150 manage the trade with Rs 1.5 filter i.e short below 150-1.5=148.5 and go long above 150.Bearish 1st target 133.7 and 2nd target 113.45 and 3rd target is 106.5
Summary:
1) Cairn is bullish above 150 aggressive traders can enter there and manage the trade with Rs 1.5 filter.
Final Words:
If you like this post do share it and leave your comment. Any question related to the topic? Feel free to ask.
Trade safe and keep checking this space for any further updates on developing resistances in between. Also check out our other publications on Nifty, Bank-nifty and other stock specific at the left hand column.
Trade safe and keep checking this space for any further updates on developing resistances in between. Also check out our other publications on Nifty, Bank-nifty and other stock specific at the left hand column.
Tuesday 31 May 2016
Flow chart to help select stocks for investing.
 |
| Flow chart for selecting stocks for investment |
Credit: Sunil Saranjame.

Sunday 29 May 2016
Bullish Possibility:
In our earlier post on Tatamotors we mentioned:Till tatamotors is below 416-431 and above 360-368 it is purely in consolidation zone for positional traders.Now let's see where we are:
 | |
| Tatamotors Daily Chart |
Bearish Possibility:
Bearish corrections possible till we are floating below 404. Hence hold any short positions with 404 as SAR with 2 points filter value.
Summary:
1) Tatamotors SAR is at 404 hence go long in tatamotors above 404 with 2 points filter.
Final Words:
If you like this post do share it and leave your comment. Any question related to the topic? Feel free to ask.
Trade safe and keep checking this space for any further updates on developing resistances in between. Also check out our other publications on Nifty, Bank-nifty and other stock specific at the left hand column. You can also visit my masters (Ilango) blog for daily updates on Nifty. Happy Trading. As my mater says, Get Rich Slowly and Quietly. Cheers!!
Trade safe and keep checking this space for any further updates on developing resistances in between. Also check out our other publications on Nifty, Bank-nifty and other stock specific at the left hand column. You can also visit my masters (Ilango) blog for daily updates on Nifty. Happy Trading. As my mater says, Get Rich Slowly and Quietly. Cheers!!
Bullish Possibility:
In our earlier post on Maruti, we mentioned:For the last couple of weeks Maruti has put on couple of doji signals on weekly chart. Doji signals indicated indecisiveness between bulls and bears and also some times indicate formation of tops. But the good thing is that Maruti still floating above 3800. So till this is trading above 3800 bulls are safe and look for first target at 4177 and next 4340 approx.Now let's analyze where we are in this counter. Last week Maruti opened at 3964, made low at 3893, high at 4162 and closed at 4146.6. So we are almost near our first target of 4177.
 |
| Maruti Daily Chart |
Bearish Possibility:
As a trader we should always be ready with our stops and reversal levels. Hence traders should hold on to their long positions with stops moving to entry point i.e 3800 level and should use this as SAR for short entry.
Summary:
1) Maruti has resumed it's primary long term trend which is long.
2) Traders should hold on long with SAR at entry point i.e 3800 as this is a medium term trade hence no aggressiveness.
Final Words:
If you like this post do share it and leave your comment. Any question related to the topic? Feel free to ask.
Trade safe and keep checking this space for any further updates on developing resistances in between. Also check out our other publications on Nifty, Bank-nifty and other stock specific at the left hand column. You can also visit my masters (Ilango) blog for daily updates on Nifty. Happy Trading. As my mater says, Get Rich Slowly and Quietly. Cheers!!
Trade safe and keep checking this space for any further updates on developing resistances in between. Also check out our other publications on Nifty, Bank-nifty and other stock specific at the left hand column. You can also visit my masters (Ilango) blog for daily updates on Nifty. Happy Trading. As my mater says, Get Rich Slowly and Quietly. Cheers!!
Bullish Possibility:
In our last post on Nifty weekly update we mentioned:
if Nifty trades above the falling channel (blue) it will be bullish and can target the upper edge of the consolidation zone which is at 7972 approximately. A successful breakout above 7808 will result in targets like 8323, 8650 and 9191 respectively.
So let's analyze where we are now:
 |
| Nifty Daily Chart |
In the above daily chart of Nifty we are now trading comfortably well above the consolidation range (the grey area in the chart) hence the targets are now 8323 and 8650. Support lies at 7808 (the upper band of the consolidation area) and 7972 (which was resistance in the past). Hence play long with SAR at 7972.
Bearish Possibility:
Bearish possibility is muted currently as long as we are trading above 7808-7972 zone.
Summary:
1) Hold longs with 7972 as SAR with filter 20 points.
Final Words:
If you like this post do share it and leave your comment. Any question related to the topic? Feel free to ask.
Trade safe and keep checking this space for any further updates on developing resistances in between. Also check out our other publications on Nifty, Bank-nifty and other stock specific at the left hand column. You can also visit my masters (Ilango) blog for daily updates on Nifty. Happy Trading. As my mater says, Get Rich Slowly and Quietly. Cheers!!
Trade safe and keep checking this space for any further updates on developing resistances in between. Also check out our other publications on Nifty, Bank-nifty and other stock specific at the left hand column. You can also visit my masters (Ilango) blog for daily updates on Nifty. Happy Trading. As my mater says, Get Rich Slowly and Quietly. Cheers!!
We posted in our last weekly update on Banknifty on 16/05/2016 that
This is a clear breakout of Banknifty trading well above the falling broadening wedge pattern (blue lines). Now let's analyze Banknifty for the coming week.
Targets are as marked on the chart, 1) 18036 2) 19041 and 3) 20553
2) The first support zone is at 17442-17302, next 16997 and final support zone is at 16343-16197.
3) Targets are as marked on the chart, 1) 18036 2) 19041 and 3) 20553
for bullishness Banknifty needs to trade above this blue resistance line which for next week lies at 16652 as can be seen from the above chart.And also
1) Play long with 16652 as SAR with 50 points filter.Now see what happened in the below daily chart of banknifty:
2) Banknifty in consolidation move for the last 1 month, decisive move ahead.
 |
| Banknifty Daily Chart |
Bullish Possibility:
As can be seen from the above chart till Banknifty is trading above the upper blue line bulls are safe. The first support zone is at 17442-17302, next 16997 and final support zone is at 16343-16197.Targets are as marked on the chart, 1) 18036 2) 19041 and 3) 20553
Bearish Possibility:
Bearish possibilities are currently muted now as long as we trade above the upper blue line of the falling broadening wedge pattern (blue lines). But in case if we then the immediate target would be 16343 and 16196.
Summary:
1) Banknifty is bullish above the upper blue line of the falling broadening wedge pattern.2) The first support zone is at 17442-17302, next 16997 and final support zone is at 16343-16197.
3) Targets are as marked on the chart, 1) 18036 2) 19041 and 3) 20553
Final Words:
If you like this post do share it and leave your comment. Any question related to the topic? Feel free to ask.
Trade safe and keep checking this space for any further updates on developing resistances in between. Also check out our other publications on Nifty, Bank-nifty and other stock specific at the left hand column. You can also visit my masters (Ilango) blog for daily updates on Nifty. Happy Trading. As my mater says, Get Rich Slowly and Quietly. Cheers!!
Trade safe and keep checking this space for any further updates on developing resistances in between. Also check out our other publications on Nifty, Bank-nifty and other stock specific at the left hand column. You can also visit my masters (Ilango) blog for daily updates on Nifty. Happy Trading. As my mater says, Get Rich Slowly and Quietly. Cheers!!
Bullish possibilities:
So far have been trading in Banknifty, Nifty, Tatamotors and Maruti but looks like a new bullish cycle is about to popup in Cairn. Below is the daily chart of Cairn. |
| Cairn Daily Chart |
As can be seen from the above chart that all 5 bearish waves looks like completed in Cairn and this stock is going to start a new bullish cycle now. Though I expect wave 1 of this bullish cycle already done at 158.4 and we are now in the wave 2 correction and almost about to break the down trendline. Hence it is a sure buy above 150. As can be seen from the above chart first target is the Fibonacci 38.6% i.e 213, 2nd target Fibonacci 50% i.e 246 and 3rd target is Fibonacci 61.8% i.e 279.
Bearish Possibilities:
Bearish below 150 hence if you enter a long at 150 manage the trade with Rs 1.5 filter i.e short below 150-1.5=148.5 and go long above 150.Bearish 1st target 133.7 and 2nd target 113.45 and 3rd target is 106.5
Summary:
1) Cairn is bullish above 150 aggressive traders can enter there and manage the trade with Rs 1.5 filter.
Final Words:
If you like this post do share it and leave your comment. Any question related to the topic? Feel free to ask.
Trade safe and keep checking this space for any further updates on developing resistances in between. Also check out our other publications on Nifty, Bank-nifty and other stock specific at the left hand column. You can also visit my masters (Ilango) blog for daily updates on Nifty. Happy Trading. As my mater says, Get Rich Slowly and Quietly. Cheers!!
Trade safe and keep checking this space for any further updates on developing resistances in between. Also check out our other publications on Nifty, Bank-nifty and other stock specific at the left hand column. You can also visit my masters (Ilango) blog for daily updates on Nifty. Happy Trading. As my mater says, Get Rich Slowly and Quietly. Cheers!!
Thursday 19 May 2016
Update on 19/05/16 3:20 PM
 Summary:
1) Nifty breakdown level=7778
2) Current range=7922-7778
Update on 20/05/16 10:20 AM

Summary:
1) Nifty triangle breakdown happened.
Update on 19/05/2016 3:00 PM
Summary:
1) Banknifty triangle breakdown below 16550.
2) Current range 16800-16550.
Update on 20/05/2016 10:20 AM

Summary:
1) Banknifty triangle breakdown happened below 16550.
 |
| Banknifty Hourly |
Summary:
1) Banknifty triangle breakdown below 16550.
2) Current range 16800-16550.
Update on 20/05/2016 10:20 AM

Summary:
1) Banknifty triangle breakdown happened below 16550.
Sunday 15 May 2016
15/05/2016 03:23 PM IST
In Debtrades, last week we mentioned that,
For the last couple of weeks Maruti has put on couple of doji signals on weekly chart. Doji signals indicated indecisiveness between bulls and bears and also some times indicate formation of tops. But the good thing is that Maruti still floating above 3800. So till this is trading above 3800 bulls are safe and look for first target at 4177 and next 4340 approx.
Unquote:
Now let's analyze how this stock can trade this week. We will first consider the bullish possibility.
Bullish Possibility:
As can be seen from the above weekly chart, Maruti has put another doji last week indicating indecision between bulls and bears but the good thing is that, Maruti still trading above 7800 and till it is trading above 7800 there is a good chance that this counter can reach up to 4340.
Bearish Possibility:

Below 7800 Maruti can target the lower edge of the consolidation rectangle marked in red in the chart which is at 3600 odd levels.
Summary:
1) Maruti is trading above the consolidation range, 3800-3600.
2) Till Maruti is trading above 3800 can potentially target up to 4340.
3) Maintain a long position with 3800 as the SAR value with 20 points filter.
Final words:
If you like this post do share it and leave your comment. Any question related to the topic? Feel free to ask.
Trade safe and keep checking this space for any further updates on developing resistances in between. Also check out our other publications on Nifty, Bank-nifty and other stock specific at the left hand column. You can also visit my masters (Ilango) blog for daily updates on Nifty. Happy Trading. As my mater says, Get Rich Slowly and Quietly. Cheers!!
In Debtrades, last week we mentioned that,
Quote:
For the last couple of weeks Maruti has put on couple of doji signals on weekly chart. Doji signals indicated indecisiveness between bulls and bears and also some times indicate formation of tops. But the good thing is that Maruti still floating above 3800. So till this is trading above 3800 bulls are safe and look for first target at 4177 and next 4340 approx.
Unquote:
Last week Maruti opened at 3830, made a low at 3790, high at 3909.8 and finally closed at 3846. So we are still lagging in momentum in this stock.
Now let's analyze how this stock can trade this week. We will first consider the bullish possibility.
Bullish Possibility:
 | |||||||||||||||||||||||||||||||||||||
| Maruti Weekly Chart |
Bearish Possibility:

Below 7800 Maruti can target the lower edge of the consolidation rectangle marked in red in the chart which is at 3600 odd levels.
Summary:
1) Maruti is trading above the consolidation range, 3800-3600.
2) Till Maruti is trading above 3800 can potentially target up to 4340.
3) Maintain a long position with 3800 as the SAR value with 20 points filter.
Final words:
If you like this post do share it and leave your comment. Any question related to the topic? Feel free to ask.
Trade safe and keep checking this space for any further updates on developing resistances in between. Also check out our other publications on Nifty, Bank-nifty and other stock specific at the left hand column. You can also visit my masters (Ilango) blog for daily updates on Nifty. Happy Trading. As my mater says, Get Rich Slowly and Quietly. Cheers!!
15/05/2016 02:11 PM IST
Last week in Debtrades we discussed,
Risk takers can take a long trade if Nifty move past the red resistance line next week. Currently the resistance is at 7713 but would suggest to go long above the break of the previous pivot at 7773. If long taken the position should be maintained with 20 points SAR.
Unquote:
Now let's analyze Nifty for this week. We will start with Bullish Possibility.
Bullish Possibility:
As can be seen from the above chart Nifty is still in the consolidation zone (the grey rectangle) but last week Nifty has painted a bullish candle on the chart though has closed just at the blue resistance line. So for this week if Nifty trades above the falling channel (blue) it will be bullish and can target the upper edge of the consolidation zone which is at 7972 approximately. A successful breakout above 7808 will result in targets like 8323 and 8650 respectively.
Bearish Possibility:
If Nifty fails to float above 7808 then could potentially target the lower edge of the consolidation rectangle which is at 7574. Also as can be seen from the above Daily chart of Nifty, it is currently in a corrective channel (red). If Nifty fails to move past the last week high of 7916 in coming sessions could potentially target the lower edge of the falling channel which is 7620 currently and this will move much lower as the time passes by.
Summary:
1) Till Nifty is below 7972 it is in consolidation phase.
2) No long should exist below 7808. Hence use 7808 as the SAR for your position with a filter value of 20 points.
Final words:
If you like this post do share it and leave your comment. Any question related to the topic? Feel free to ask.
Trade safe and keep checking this space for any further updates on developing resistances in between. Also check out our other publications on Nifty, Bank-nifty and other stock specific at the left hand column. You can also visit my masters (Ilango) blog for daily updates on Nifty. Happy Trading. As my mater says, Get Rich Slowly and Quietly. Cheers!!
Last week in Debtrades we discussed,
Quote:
Risk takers can take a long trade if Nifty move past the red resistance line next week. Currently the resistance is at 7713 but would suggest to go long above the break of the previous pivot at 7773. If long taken the position should be maintained with 20 points SAR.
Unquote:
Last week Nifty opened at 7755, made a low at 7754 and almost immediately moved to 7773. The week high was at 7916 and closed at 7814.9.
Now let's analyze Nifty for this week. We will start with Bullish Possibility.
Bullish Possibility:
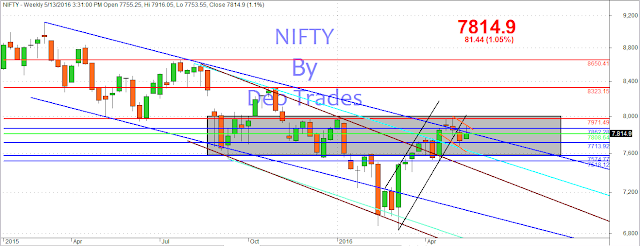 | |||||
| Nifty Weekly Chart |
Bearish Possibility:
 |
| Nifty Daily Chart |
Summary:
1) Till Nifty is below 7972 it is in consolidation phase.
2) No long should exist below 7808. Hence use 7808 as the SAR for your position with a filter value of 20 points.
Final words:
If you like this post do share it and leave your comment. Any question related to the topic? Feel free to ask.
Trade safe and keep checking this space for any further updates on developing resistances in between. Also check out our other publications on Nifty, Bank-nifty and other stock specific at the left hand column. You can also visit my masters (Ilango) blog for daily updates on Nifty. Happy Trading. As my mater says, Get Rich Slowly and Quietly. Cheers!!
15/05/2016 10:45 AM IST
In Debtrades last week we mentioned:
A slight bullish possibility exists only if Banknifty breaks the falling red trendline. But that can not be confirmed till Banknifty is below 16922 or the top line of the blue descending broadening wedge pattern. So a bullish attempt can be made but only above 16400 not below it while keeping a close key on the key resistance level 16922.
Unquote:
Let's now analyze what's there in Banknifty Store for this week.
Bullish Possibility:
As can be seen from the above Banknifty weekly chart last week Banknifty put on a green candle on the weekly chart which is bullish but still trading below the broadening falling wedge pattern (blue lines) which is not good. So for bullishness Banknifty needs to trade above this blue resistance line which for next week lies at 16652 as can be seen from the above chart.
Bearish Possibility:
As can be seen from the above Banknifty daily chart, Banknifty has just closed at the resistance level (upper blue line) hence unable to float above the blue line at 16652 will result a down move initially to the green line at 16200 which will also be the Wolfe wave target as well and then to 15944 and finally 15673, the 38.2% Fibonacci retracement of the entire rise as can be seen from the below Banknifty Daily Zoomed chart.
Summary:
1) Play long with 16652 as SAR with 50 points filter.
2) Banknifty in consolidation move for the last 1 month, decisive move ahead.
Final words:
If you like this post do share it and leave your comment. Any question related to the topic? Feel free to ask.
Trade safe and keep checking this space for any further updates on developing resistances in between. Also check out our other publications on Nifty, Bank-nifty and other stock specific at the left hand column. You can also visit my masters (Ilango) blog for daily updates on Nifty. Happy Trading. As my mater says, Get Rich Slowly and Quietly. Cheers!!
In Debtrades last week we mentioned:
Quote:
A slight bullish possibility exists only if Banknifty breaks the falling red trendline. But that can not be confirmed till Banknifty is below 16922 or the top line of the blue descending broadening wedge pattern. So a bullish attempt can be made but only above 16400 not below it while keeping a close key on the key resistance level 16922.
Unquote:
Now let's see now Banknifty performed last week. Banknifty opened at 16357 which is also the low of the week and zoomed in a second above 16400. The week high was 16962 just few points below 16972 that we discussed several times in the past and finally closed at 16716.9.
Let's now analyze what's there in Banknifty Store for this week.
Bullish Possibility:
 |
| Banknifty Weekly Chart |
Bearish Possibility:
 |
| Banknifty Daily Chart |
 |
| Banknifty Daily Chart Zoomed |
1) Play long with 16652 as SAR with 50 points filter.
2) Banknifty in consolidation move for the last 1 month, decisive move ahead.
Final words:
If you like this post do share it and leave your comment. Any question related to the topic? Feel free to ask.
Trade safe and keep checking this space for any further updates on developing resistances in between. Also check out our other publications on Nifty, Bank-nifty and other stock specific at the left hand column. You can also visit my masters (Ilango) blog for daily updates on Nifty. Happy Trading. As my mater says, Get Rich Slowly and Quietly. Cheers!!
Labels:
Consolidation
,
Descending Broadening Wedge
,
Fibonacci
,
ilango
,
Resistance
,
trendline
,
Wolfe wave
No comments
:
15/05/2016 08:19 AM IST
In Debtrades, lastweek we discussed that,
In ST I do not see any bullish possibilities. As mentioned in my earlier post on tatamotors, Tata Motors has a resistance at around 416-431 so until unless it move past this resistance zone no bullish possibilities exist.
.......
As can be seen from the above Tatamotors Weekly Chart, last week candle has fallen below the rising trend channel which is bearish and can target 368-360 in medium term. Though in short term this can be extremely turbulent because of consolidation as discussed earlier.
.......
Till tatamotors is below 416-431 and above 360-368 it is purely in consolidation zone for positional traders.
Unquote:
For this week lets start with Bullish Possibility.
Bullish Possibility:
As can be seen from the above daily chart, Tatamotors is currently within the falling trend channels (red and green). So once it is out of the red channel the green channel will resist the up move.
The only hope for a small bullish move exists above 393 (red down trend channel) for a possibility of 412-416 as can be seen from the above hourly chart. At 412-416 it will meet with the green channel resistance so taking 393 as SAR with filter of 2 points, a small long position can be initiated for a target of 412-416. As discussed earlier, decent bull move only above 416-431 for a target of 600 in medium term.
Bearish Possibility:
As can be seen from the above weekly chart last 2 weekly candles has fallen out side of the ascending trend channel which is bearish.
Summary:
1) Taking 393 as the SAR, with 2 points filter a small long position can be taken.
2) Below 393 tatamotors can target 368-360 which is very good support.
3) Decent bull move only above 416-431.
4) Till tatamotors is below 416-431 and above 360-368 it is purely in consolidation zone for positional traders.
5) Below 360-368 it is only sell.
6) Above 416-431 it is only buy.
7) In consolidation buy the dips and sell the tops.
Final words:
If you like this post do share it and leave your comment. Any question related to the topic? Feel free to ask.
Trade safe and keep checking this space for any further updates on developing resistances in between. Also check out our other publications on Nifty, Bank-nifty and other stock specific at the left hand column. You can also visit my masters (Ilango) blog for daily updates on Nifty. Happy Trading. As my master says, Get Rich Slowly and Quietly. Cheers!!
In Debtrades, lastweek we discussed that,
Quote:
In ST I do not see any bullish possibilities. As mentioned in my earlier post on tatamotors, Tata Motors has a resistance at around 416-431 so until unless it move past this resistance zone no bullish possibilities exist.
.......
As can be seen from the above Tatamotors Weekly Chart, last week candle has fallen below the rising trend channel which is bearish and can target 368-360 in medium term. Though in short term this can be extremely turbulent because of consolidation as discussed earlier.
.......
Till tatamotors is below 416-431 and above 360-368 it is purely in consolidation zone for positional traders.
Unquote:
Now let's discussed how this stock performed last week. Tatamotors opened at 400.45, made high at 405.2 and fall to low at 376.1, finally closing at 389.95.
For this week lets start with Bullish Possibility.
Bullish Possibility:
 |
| Tatamotors Daily Chart |
 |
| Tatamotors Hourly Chart |
Bearish Possibility:
 |
| Tatamotors Weekly Chart |
As can be seen from the above weekly chart last 2 weekly candles has fallen out side of the ascending trend channel which is bearish.
Summary:
1) Taking 393 as the SAR, with 2 points filter a small long position can be taken.
2) Below 393 tatamotors can target 368-360 which is very good support.
3) Decent bull move only above 416-431.
4) Till tatamotors is below 416-431 and above 360-368 it is purely in consolidation zone for positional traders.
5) Below 360-368 it is only sell.
6) Above 416-431 it is only buy.
7) In consolidation buy the dips and sell the tops.
Final words:
If you like this post do share it and leave your comment. Any question related to the topic? Feel free to ask.
Trade safe and keep checking this space for any further updates on developing resistances in between. Also check out our other publications on Nifty, Bank-nifty and other stock specific at the left hand column. You can also visit my masters (Ilango) blog for daily updates on Nifty. Happy Trading. As my master says, Get Rich Slowly and Quietly. Cheers!!
Sunday 8 May 2016
Bullish Possibility:
In our last post and earlier post, we discussed that,
Zooming on it's last 2 months chart we find that 3800 is a solid resistance from where it fall couple of time making this resistance a significant one. Now in coming week if this stock able to float above this resistance level then can move quickly to 4443 approx due to inverse H&S effect.
Unquote
For the last couple of weeks Maruti has put on couple of doji signals on weekly chart. Doji signals indicated indecisiveness between bulls and bears and also some times indicate formation of tops. But the good thing is that Maruti still floating above 3800. So till this is trading above 3800 bulls are safe and look for first 4177 and next 4340 approx.
Bearish Possibility:
As can be seen from the above hourly chart of Maruti, this stock is some how managed to float above 3800 last week and if dip down below 3800 then could eventually target the lower horizontal support line of the consolidation rage discussed last week which also coinciding with ascending trend channel (green channel in the above chart) support line at 3600.
Summary:
1) Maruti is bullish above 3800. Above 3800 1st target 4177 and next one 4340 approx.
2) Maruti in consolidation range in 3600-3800.
3) Short Maruti Stock below 3800 with with SAR at 3800 + Filter. For Maruti I use 20 points filter value.
Final Words:
If you like this post do share it and leave your comment. Any question related to the topic? Feel free to ask.
Trade safe and keep checking this space for any further updates on developing resistances in between. Also check out our other publications on Nifty, Bank-nifty and other stock specific at the left hand column. You can also visit my masters (Ilango) blog for daily updates on Nifty. Happy Trading. As my mater says, Get Rich Slowly and Quietly. Cheers!!
In our last post and earlier post, we discussed that,
Quote
Zooming on it's last 2 months chart we find that 3800 is a solid resistance from where it fall couple of time making this resistance a significant one. Now in coming week if this stock able to float above this resistance level then can move quickly to 4443 approx due to inverse H&S effect.
Unquote
Now let's analyze our Maruti position for this week.
 |
| Maruti Stock Weekly Chart |
For the last couple of weeks Maruti has put on couple of doji signals on weekly chart. Doji signals indicated indecisiveness between bulls and bears and also some times indicate formation of tops. But the good thing is that Maruti still floating above 3800. So till this is trading above 3800 bulls are safe and look for first 4177 and next 4340 approx.
Bearish Possibility:
 |
| Maruti Stock Hourly Chart |
Summary:
1) Maruti is bullish above 3800. Above 3800 1st target 4177 and next one 4340 approx.
2) Maruti in consolidation range in 3600-3800.
3) Short Maruti Stock below 3800 with with SAR at 3800 + Filter. For Maruti I use 20 points filter value.
Final Words:
If you like this post do share it and leave your comment. Any question related to the topic? Feel free to ask.
Trade safe and keep checking this space for any further updates on developing resistances in between. Also check out our other publications on Nifty, Bank-nifty and other stock specific at the left hand column. You can also visit my masters (Ilango) blog for daily updates on Nifty. Happy Trading. As my mater says, Get Rich Slowly and Quietly. Cheers!!
Labels:
Consolidation
,
Doji
,
Formation of Top
,
inverse H&S
,
Maruti
,
Maruti Stock
,
raising trend channel
,
Resistance
,
SAR
,
Support
No comments
:
Saturday 7 May 2016
Bullish Possibility:
As usual we will start with what we discussed last week.
Quote:
As long as we are above this long term falling trend channel we are safe and above 7972 we could target 8650 in medium term as mentioned in my earlier post.
Unquote:
So let analyze where we are now. As can be seen from the above Nifty Spot Daily chart we are no longer trading above the blue falling trend channel hence bigger bullish move is not possible until unless we are trading within this channel. The upper trendline resistance for this channel comes at around 7865. But this falls withing the Nifty Consolidation zone as marked in chart using a grey rectangle. So until unless nifty moves past 7972 we are not in a bull market but in consolidation zone which is 7575-7972 about 400 points as discussed in my earlier post.
Another small bullish possibility arises if we break above the red resistance line in next week. Let's zoom onto the chart and consider Nifty Hourly chart below.
Risk takers can take a long trade if Nifty move past the red resistance line next week. Currently the resistance is at 7713 but would suggest to go above the break of the previous pivot at 7773. If long taken the position should be maintained with 20 points SAR.
Bearish Possibility:
As can be seen from the above Nifty Weekly Chart the last week candle has fallen out side of the ascending trend channel which is bearish hence can potentially target the base of the breakout bar which is at 7521.
Summary:
1) Below 7773 Nifty is bearish.
2) Above 7773 Bullish attempt can be made but with cautious as 7972 will be the target or next resistance level.
3) Hence if short manage your shorts with 7773 as SAR (stop and reverse) with 20 points filter.
Final words:
If you like this post do share it and leave your comment. Any question related to the topic? Feel free to ask.
Trade safe and keep checking this space for any further updates on developing resistances in between. Also check out our other publications on Nifty, Bank-nifty and other stock specific at the left hand column. You can also visit my masters (Ilango) blog for daily updates on Nifty. Happy Trading. As my mater says, Get Rich Slowly and Quietly. Cheers!!
As usual we will start with what we discussed last week.
Quote:
As long as we are above this long term falling trend channel we are safe and above 7972 we could target 8650 in medium term as mentioned in my earlier post.
Unquote:
 |
| Nifty Spot Daily Chart |
So let analyze where we are now. As can be seen from the above Nifty Spot Daily chart we are no longer trading above the blue falling trend channel hence bigger bullish move is not possible until unless we are trading within this channel. The upper trendline resistance for this channel comes at around 7865. But this falls withing the Nifty Consolidation zone as marked in chart using a grey rectangle. So until unless nifty moves past 7972 we are not in a bull market but in consolidation zone which is 7575-7972 about 400 points as discussed in my earlier post.
Another small bullish possibility arises if we break above the red resistance line in next week. Let's zoom onto the chart and consider Nifty Hourly chart below.
 |
| Nifty Spot Hourly Chart |
Risk takers can take a long trade if Nifty move past the red resistance line next week. Currently the resistance is at 7713 but would suggest to go above the break of the previous pivot at 7773. If long taken the position should be maintained with 20 points SAR.
Bearish Possibility:
 | ||||||
| Nifty Spot Weekly Chart |
As can be seen from the above Nifty Weekly Chart the last week candle has fallen out side of the ascending trend channel which is bearish hence can potentially target the base of the breakout bar which is at 7521.
Summary:
1) Below 7773 Nifty is bearish.
2) Above 7773 Bullish attempt can be made but with cautious as 7972 will be the target or next resistance level.
3) Hence if short manage your shorts with 7773 as SAR (stop and reverse) with 20 points filter.
Final words:
If you like this post do share it and leave your comment. Any question related to the topic? Feel free to ask.
Trade safe and keep checking this space for any further updates on developing resistances in between. Also check out our other publications on Nifty, Bank-nifty and other stock specific at the left hand column. You can also visit my masters (Ilango) blog for daily updates on Nifty. Happy Trading. As my mater says, Get Rich Slowly and Quietly. Cheers!!
Labels:
ascending trend channel
,
break out
,
Breakout
,
Consolidation
,
Falling trend channel
,
Nifty
,
Nifty Spot
,
Rising Channel
,
Trading Nifty
No comments
:
Subscribe to:
Posts
(
Atom
)
