15/05/2016 10:45 AM IST
In Debtrades last week we mentioned:
A slight bullish possibility exists only if Banknifty breaks the falling red trendline. But that can not be confirmed till Banknifty is below 16922 or the top line of the blue descending broadening wedge pattern. So a bullish attempt can be made but only above 16400 not below it while keeping a close key on the key resistance level 16922.
Unquote:
Let's now analyze what's there in Banknifty Store for this week.
Bullish Possibility:
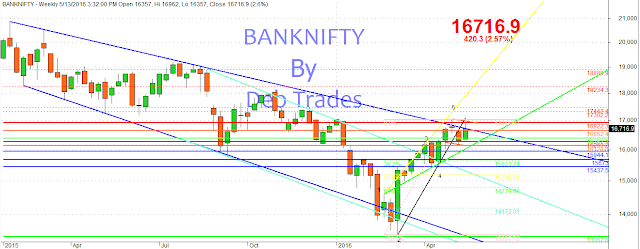
As can be seen from the above Banknifty weekly chart last week Banknifty put on a green candle on the weekly chart which is bullish but still trading below the broadening falling wedge pattern (blue lines) which is not good. So for bullishness Banknifty needs to trade above this blue resistance line which for next week lies at 16652 as can be seen from the above chart.
Bearish Possibility:
As can be seen from the above Banknifty daily chart, Banknifty has just closed at the resistance level (upper blue line) hence unable to float above the blue line at 16652 will result a down move initially to the green line at 16200 which will also be the Wolfe wave target as well and then to 15944 and finally 15673, the 38.2% Fibonacci retracement of the entire rise as can be seen from the below Banknifty Daily Zoomed chart.
Summary:
1) Play long with 16652 as SAR with 50 points filter.
2) Banknifty in consolidation move for the last 1 month, decisive move ahead.
Final words:
If you like this post do share it and leave your comment. Any question related to the topic? Feel free to ask.
Trade safe and keep checking this space for any further updates on developing resistances in between. Also check out our other publications on Nifty, Bank-nifty and other stock specific at the left hand column. You can also visit my masters (Ilango) blog for daily updates on Nifty. Happy Trading. As my mater says, Get Rich Slowly and Quietly. Cheers!!
In Debtrades last week we mentioned:
Quote:
A slight bullish possibility exists only if Banknifty breaks the falling red trendline. But that can not be confirmed till Banknifty is below 16922 or the top line of the blue descending broadening wedge pattern. So a bullish attempt can be made but only above 16400 not below it while keeping a close key on the key resistance level 16922.
Unquote:
Now let's see now Banknifty performed last week. Banknifty opened at 16357 which is also the low of the week and zoomed in a second above 16400. The week high was 16962 just few points below 16972 that we discussed several times in the past and finally closed at 16716.9.
Let's now analyze what's there in Banknifty Store for this week.
Bullish Possibility:
 |
| Banknifty Weekly Chart |
Bearish Possibility:
 |
| Banknifty Daily Chart |
 |
| Banknifty Daily Chart Zoomed |
1) Play long with 16652 as SAR with 50 points filter.
2) Banknifty in consolidation move for the last 1 month, decisive move ahead.
Final words:
If you like this post do share it and leave your comment. Any question related to the topic? Feel free to ask.
Trade safe and keep checking this space for any further updates on developing resistances in between. Also check out our other publications on Nifty, Bank-nifty and other stock specific at the left hand column. You can also visit my masters (Ilango) blog for daily updates on Nifty. Happy Trading. As my mater says, Get Rich Slowly and Quietly. Cheers!!
No comments :
Post a Comment